Lof8 wrote: I don't want to poop on your data acquisition, but to me, I'd rather just sit down, hold on, and try to haul ass :) Those graphs and all just look like a headache. There are so many variables in every run, I'd prefer to just "feel" what works and what doesn't. Anyway, carry on and good luck.
That's what I did when I was driving, and what I intend to do in the future. I'm not looking at the data between runs to try and figure out what I can do to be faster. However, back at home, I think it can be useful. How am I driving? What did I do on a fast run compared to a slow run? Can I change my behavior to do that again? What is the car doing? Do I have wheelspin or not? I would have told you that other than the start, I only had slight wheelspin at one spot on the course. I was wrong. I can't put down the power (with only 100 hp) as well as I thought I could. Can I change the car setup or my driving to fix that? How is my launch? I know what feels fastest, but is that RPM really the fastest or will a different one help.
I think there's a lot that the data can tell me about me that I simply can't see or feel because I'm so wrapped up in driving at the time. Additionally, for me, this is fun. One day of driving can stretch far into the week as I look at the data and try to figure out what happened. I actually like this.
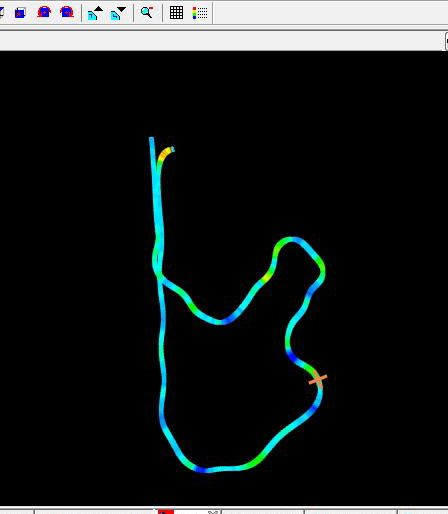
One other screen you can look at in the software is a map view. This gives you a view of the track that is drawn from the gps data. On top of that, you can assign a data channel and it will give it a color bar and plot it on the track. For this plot I did a math channel of two data streams captured from the car. One is the speed channel which is the output of the speedometer. The other is vehicle ground speed which is a value that the car calculates from all of the wheel speed sensors and probably it's accelerometer. I think it uses for stability control. I subtracted the ground speed from the speedometer speed and this is what I got.

The areas that are a constant light blue are where the car is behaving. At the first hook at the course start you see the color is red which indicates a bunch of wheel slip. The areas that are a dark blue correspond to ABS events. What exactly I'm locking up, I don't know. They all look far enough out on the corner that I suspect that it's a braking issue and not just wheel lift. I would have told you that the ABS never activated other than the stop box. I was wrong. The yellow areas are wheel spin. The brightest area after the tight corner is the one spot where I thought I might have a tiny bit of spin. Turns out that I was right with that, but I might have it in quite a few other areas. Things to work on either with driving style or car setup.
In reply to mazdeuce:
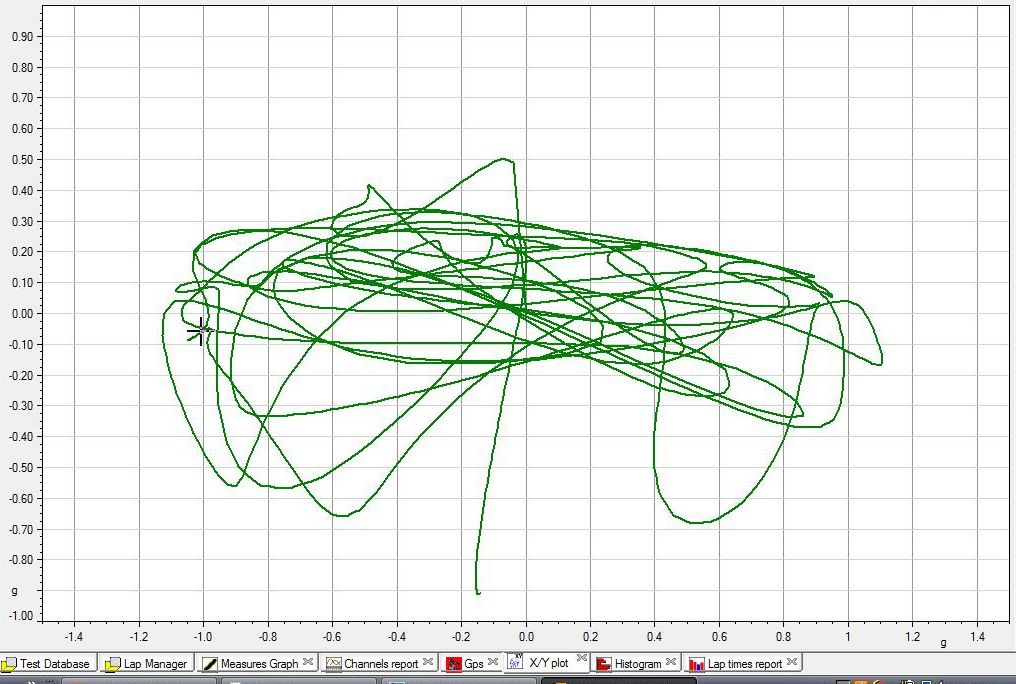
It really would help if you turn the G-G diagram. On the XY plot go the the settings button or from the menu go to Options>settings. On the setup window select the lateral G for the X axis, apply and exit. Now from the measures window on the left go down and select Long G.
With this you now have a nice friction circle for how the car was driven. A lot can be told with this graphic.
Also, use line rather than scatter.
Finally, what is your logging rate, it looks low.
In the end you will want to build profiles for different tasks in analyzing the car. With a little practice you should be able to fully analyze the car and your performance in 30 minutes. Eazy to do between runs.
Ok, I've got the G-G diagram turned and plotted with lines instead of dots. Maybe I have a well defined friction circle? It looks cool, but can I use this in any way really? Maybe as a comparison when I start to get a library of them?

I checked and my logging rate is 10Hz for everything. That's not good. I can only increase it to 50Hz in the program. It seems like I would want higher for some things but I wonder if pulling out of the OBDII port is inherently slow. I assume I should turn everything that matters to 50Hz for the next event and see how it goes. The GPS is at 10Hz and I don't think I can increase that. Because of that limitation, my calculated G's are stuck at 10Hz. Using the accelerometers in the logger is problematic because it's hard to get them squared to the car. Doing my best I'm getting distorted data from them. With the car's accelerometers I can get good lateral data but there's no longitudinal data. I still learning setup and what data I have and can use here. I think you're right that once I figure all of this out, it shouldn't take too much time at all to generate the reports. I really need to figure out how to break the track up into sectors. Maybe that's my task for today.
I think the ABS events you're seeing are where the inside rear wheel lifts while you're turning and braking. Once the wheel's in the air it will decelerate suddenly and the ABS will kick in - to the ABS system which doesn't know if the wheel is touching the ground or not, it just looks like the wheel is locking up.
The friction circle (G-G diagram) does tell a lot on it's own. The 10 Hz is not all that bad for G, but other items it may be one notch slow.
Make a profile and place your G-G diagram on it and include a measures graph of speed and a track map (don't forget to save the profile).
Start at the left side of the speed plot and use your arrow keys to advance through the run. As you are doing that watch where the cursor is on the friction circle. That will tell you what you did and show where there may be more. It looks like you left some on the table in a corner or two.
Enjoy![]()
Holy E36 M3. I didn't even realize how I could use the cursor to mark a spot on one plot and have it show up on another. This......changes.......everything....... You've completely ruined any productivity that I might have had for today. Thank you so much. I also need to work on getting a profile set so the plots are just there. Wow, this is cooler than I thought. So much cooler.
Think how the guys in my data acq classes feel?![]() They never get any sleep.
They never get any sleep.
You have offically been bitten by the data bug. The vast majority of people have no idea just how cool data acq really is.
Now, take what feel this morning, buy a steering sensor and multiply that feeling by 100 times. That is why every professional race team from NASCAR to IRL are so deeply involved in data acq![]()
Mazdeuce,
You have only looked at the response to what you do with the wheel and pedals. Add a few layers of complication when you get to active drivetrain and chassis control systems. Think traction control, engine and transmission. Then you get to the point of being forced out of the track each night. I was once accused of only needing data, spread sheets and beer. I agreed and went back to tuning for the current track in the European LeMans Series GT1 class. Sleep was only achieved on the trips back home between events.
In reply to stafford1500:
Now that sounds like a good time. I used to work 15 hour days 6-8 weeks at a time no days off doing data QC for seismic crews collecting data for 3D shoots for oil companies. If you've got to look at data all day, GT1 data sounds far more interesting than seismic data.
Two weeks ago I though the data I could pull from OBDII would be more than I could want. Now wiring up the entire car for shock position sensors and steering angle and everything else sounds perfectly reasonable. It's not hard to imagine a car in my future where the electronics are worth far more than the car.
Now you guys are talking.
When I'm on the road racing I usually sleep 4 hr/day and even then you have to make your self stop because it is so cool to see everthing the car and driver are doing. You then go back to your modeling software and think about changes to the car for the next day to see if you can get better performance and verify it with the next day's data and the wheel goes round and round.
However the electronics don't have to get that expensive. You would be floored with what can be done with a $5k system., Damn near rocket stuff.
This thread is due for an update. After my track day this weekend I am thinking about data again. The aim Solo seems like a great low entry point and supports point to point as well as circuit so should work for AutoX
One issue I have is my car is a 90 NA6 miata so I don't think getting the DL would be worth it? Or how do I find out if the unit can talk to the stock ECU?
Did you ever figure out steering angle? Since I don't have ABS or Traction control I don't think I could do wheelspeed either
I haven't figured out steering angle. I'm convinced it's there somewhere, but the software I'm running isn't reading it. One of the best things about the DL is its ability to record all of the sensors that are on the car and map them in relation to the gps track mapping. Quite frankly, without all of those sensors to read, I'm not sure I'd bother with something like the solo. I think you'd get 99% of the info from one of the better smart phone apps that records GPS position and acceleration.
Most the smart phone apps will need at least 100 bucks spent on a GPS reciever. So far the phone mount was not stable enough on the miata to make the video worth using but maybe I need to try another mount. And I don't think any of the smart phone apps are doing predictive lap times? (which for circuits I think is the number 1 thing to have)
I think you need to look at what information you want and go from there. For me it's hard to comment outside the data that is pulled off the ecu and all that I can do with it. Honestly, the timing function is the part I use least in an autocross situation. I tend to analyze my speed on course at any given point and try to figure out what inputs on my part resulted in that speed.
You'll need to log in to post.