I need a data system that says this:
One time is a fluke, twice is coincidence, and three times is a pattern. I think the quote is originally attributed to Ian Fleming, although I’m most familiar with it coming from Chris Berman of “SportsCenter.” It popped into my head when reviewing some of my recent data from Daytona.
I’m more than willing to admit I have some on-track habits that could be costing tenths here and there, and my generally competitive nature means that I’m always looking for places to improve.
You don’t need a lot of sophisticated graphs for this, either. OBD or hardwired connections to the car are great, but you can also fall into a trap of overanalysis with too much data. Simply using a speed/distance graph, a lateral g graph and a longitudinal g graph can return a wealth of information that you can dissect quickly–even between sessions–and turn into a plan of action or at least further investigation. We keep our VBox data acquisition setup rather busy.
[VBox HD Lite: Big data power in a tiny, efficient package]

Figure 1
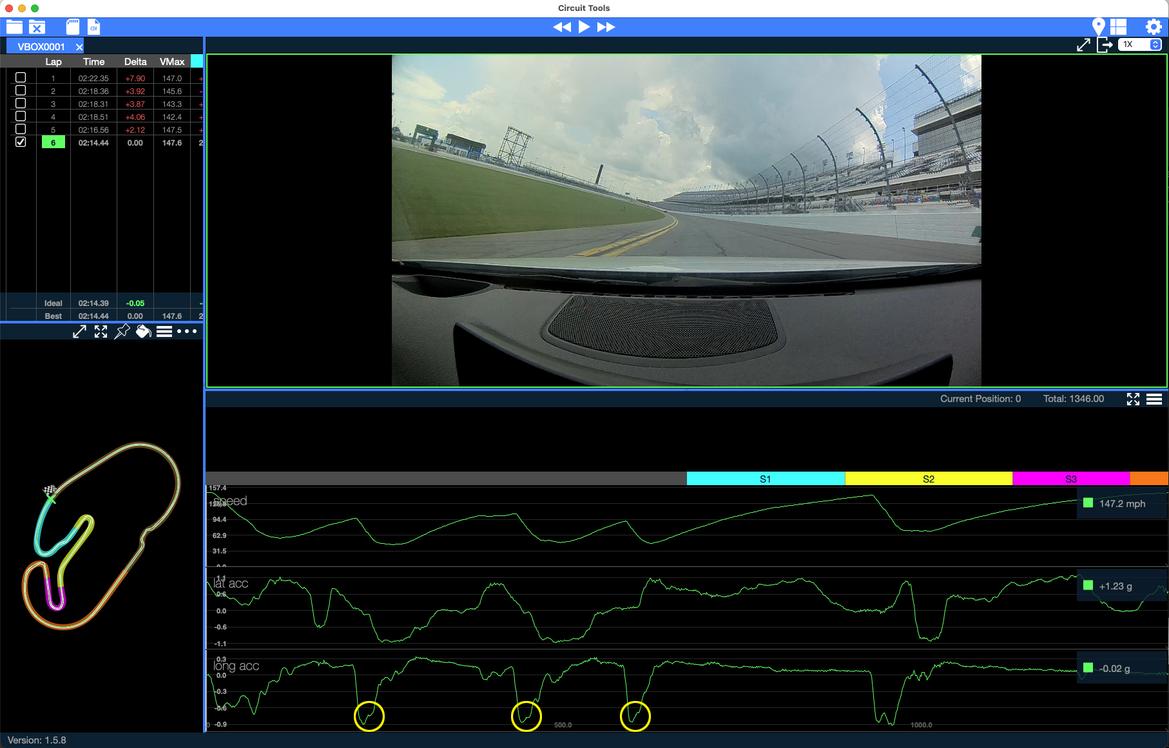
So, back to Daytona and a pattern I noticed in three corners: In Turns 3, 5 and 6, those being the east and west horseshoes and the left-hander onto the west banking, I see a “stairstep” (Figure 1) on the longitudinal g trace that precisely corresponds with the moment that the lateral g trace starts to react–in other words, right at the moment of turn-in.
This stairstep shows a moment where braking g stops decreasing–or even fractionally increases–right at turn-in. So, at the very least, I’m pausing my brake release as I trail brake into a corner–or worse, even slightly increasing brake pressure as I turn in.
So the question is why am I doing this? And once I have a hypothesis there, I can start working on a plan to correct it in subsequent sessions.

Figure 2
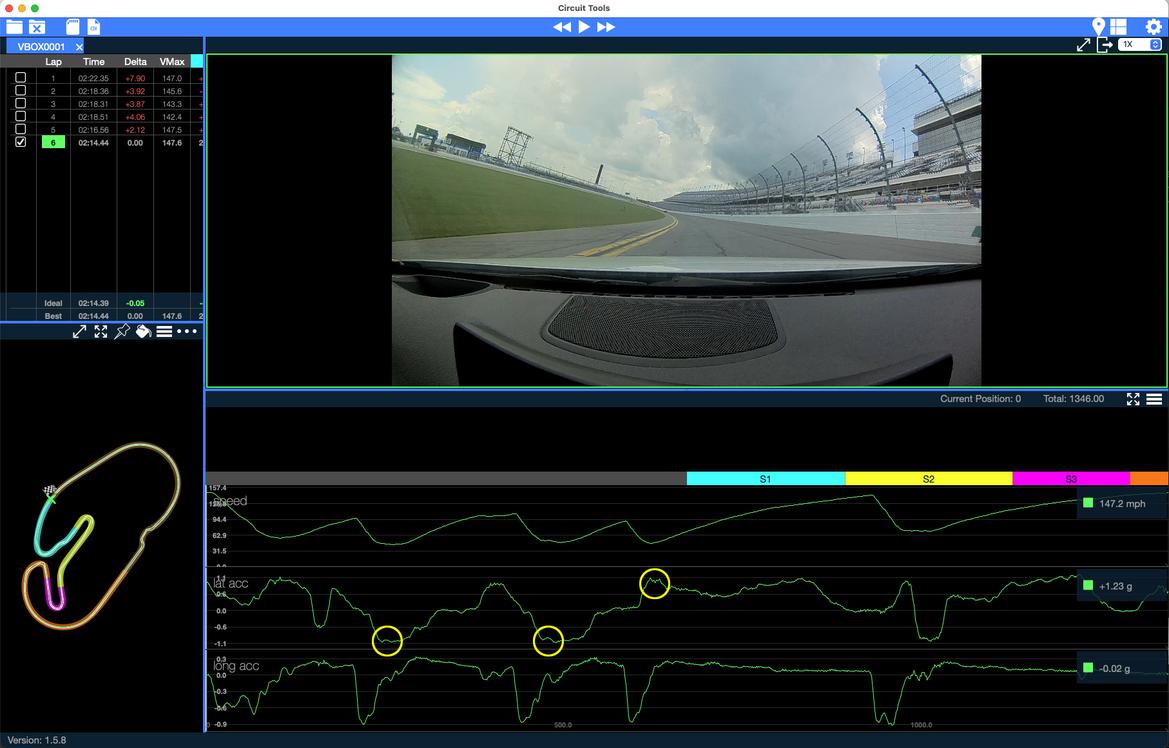
To bring more data into the conversation, let’s look just a bit further down the timeline on the lateral acceleration trace. As soon as I start to hit max lateral g, there’s a momentary swing-in load where the car suddenly experiences less lateral loading (Figure 2).
On the track map and in the video, I can see that this is happening post-braking but pre-apex, so there’s a small phase toward the end of the first third of the corner where the car is doing less work than it should.
So, supposition time: I’m turning into these corners too early and/or not extending the braking phase far enough. Ideally I want the release phase of that longitudinal g trace to climb smoothly toward the apex as the lateral g trace builds at the same time.
Both of those traces should level out and begin heading the other direction at the apex, where deceleration is complete and for a brief moment there’s pure cornering. Of course, these long, 180° corners at Daytona exaggerate the mid-corner phase, but the entry principles should be similar.
By turning too early, I have to adjust speed a bit more in the very early part of the corner, leading to the longitudinal stairstep. Then, once I commit to full turn-in, my angle isn’t ideal, so I’m either understeering or having to reduce speed or wheel angle–hence the momentary reduction in lateral g just after the longitudinal hiccup.
Ideally I want to brake once, release smoothly all the way to or very near the apex, and then accelerate out.
The first step I’ll take toward correction is pushing my turn-in a bit later and using slightly more initial wheel angle. This additional wheel angle is going to take more initial brake release, so I know my first few attempts are going to look even jankier than this graph. Still, the goal is to first get rid of those stairsteps–even if it means exaggerating the inputs–then adding polish to the technique.
I’d also like to add that this chart overall still looks pretty good. Even though these mistakes show up on the lateral and longitudinal g graphs, the speed trace looks smooth, and my errors are not causing huge losses of time. But once you solve the huge losses of time, all that’s left to solve are the small things, and multiple small things tend to add up quickly if they’re not remedied before they become ingrained bad habits.
And the takeaway message here, as it is frequently, is that you don’t need a lot of data to make a solid plan for improvement. The key is taking whatever data you have and reviewing it honestly, with an eye toward pattern recognition and mistake mitigation.
David S. Wallens said:I need a data system that says this:
I've long wanted a voice pack for the catalyst that told me how much I suck, not the gentle "keep pushing."
"You call that an apex!?"
"Do you even KNOW where the accelerator is?"
Etc...
If there's one good thing to come from AI I hope it's celebrity voices for GPS and data systems. I know I'd be faster if Gene Hackman was encouraging me to brake later.
WonkoTheSane said:I've long wanted a voice pack for the catalyst that told me how much I suck, not the gentle "keep pushing."
"You call that an apex!?"
"Do you even KNOW where the accelerator is?"
Etc...
I have crew chief setup for sims with a kinda abusive voice. It would be fun if my catalyst could have different setups installed like that.
Displaying 1-5 of 5 commentsView all comments on the GRM forums
You'll need to log in to post.